Creating and Evaluating Synthetic Tabular Data
Synthetic tabular data mimics real tables without exposing real rows—handy for privacy, testing, or training when you can’t share the original. The catch is making sure the fake data is both useful and safe. One approach that scales without a GPU is sequential synthesis (one column at a time); then you need to check utility and re-identification risk. Here’s a minimal setup and three checks that work.
Sequential synthesis: one column at a time
Sequential synthesis works well when you don’t have a GPU or need to generate large tables: build the data one column at a time, each new column modeled and sampled given the ones you already have. For each column you pick a simple model that fits the type (e.g. regression for numbers, multinomial for categories), fit it, then sample. You choose the column order so dependencies make sense (e.g. age before income). Everything runs on CPU and you can inspect each step, so it’s interpretable. The downside is you don’t capture very complex joint patterns that deep generators might; but for many use cases it’s enough and it scales.
Once you have synthetic data, you need to ask: does it preserve utility (can you still do useful analysis?) and limit privacy risk (can someone re-identify people)? Below are three checks that work in practice.
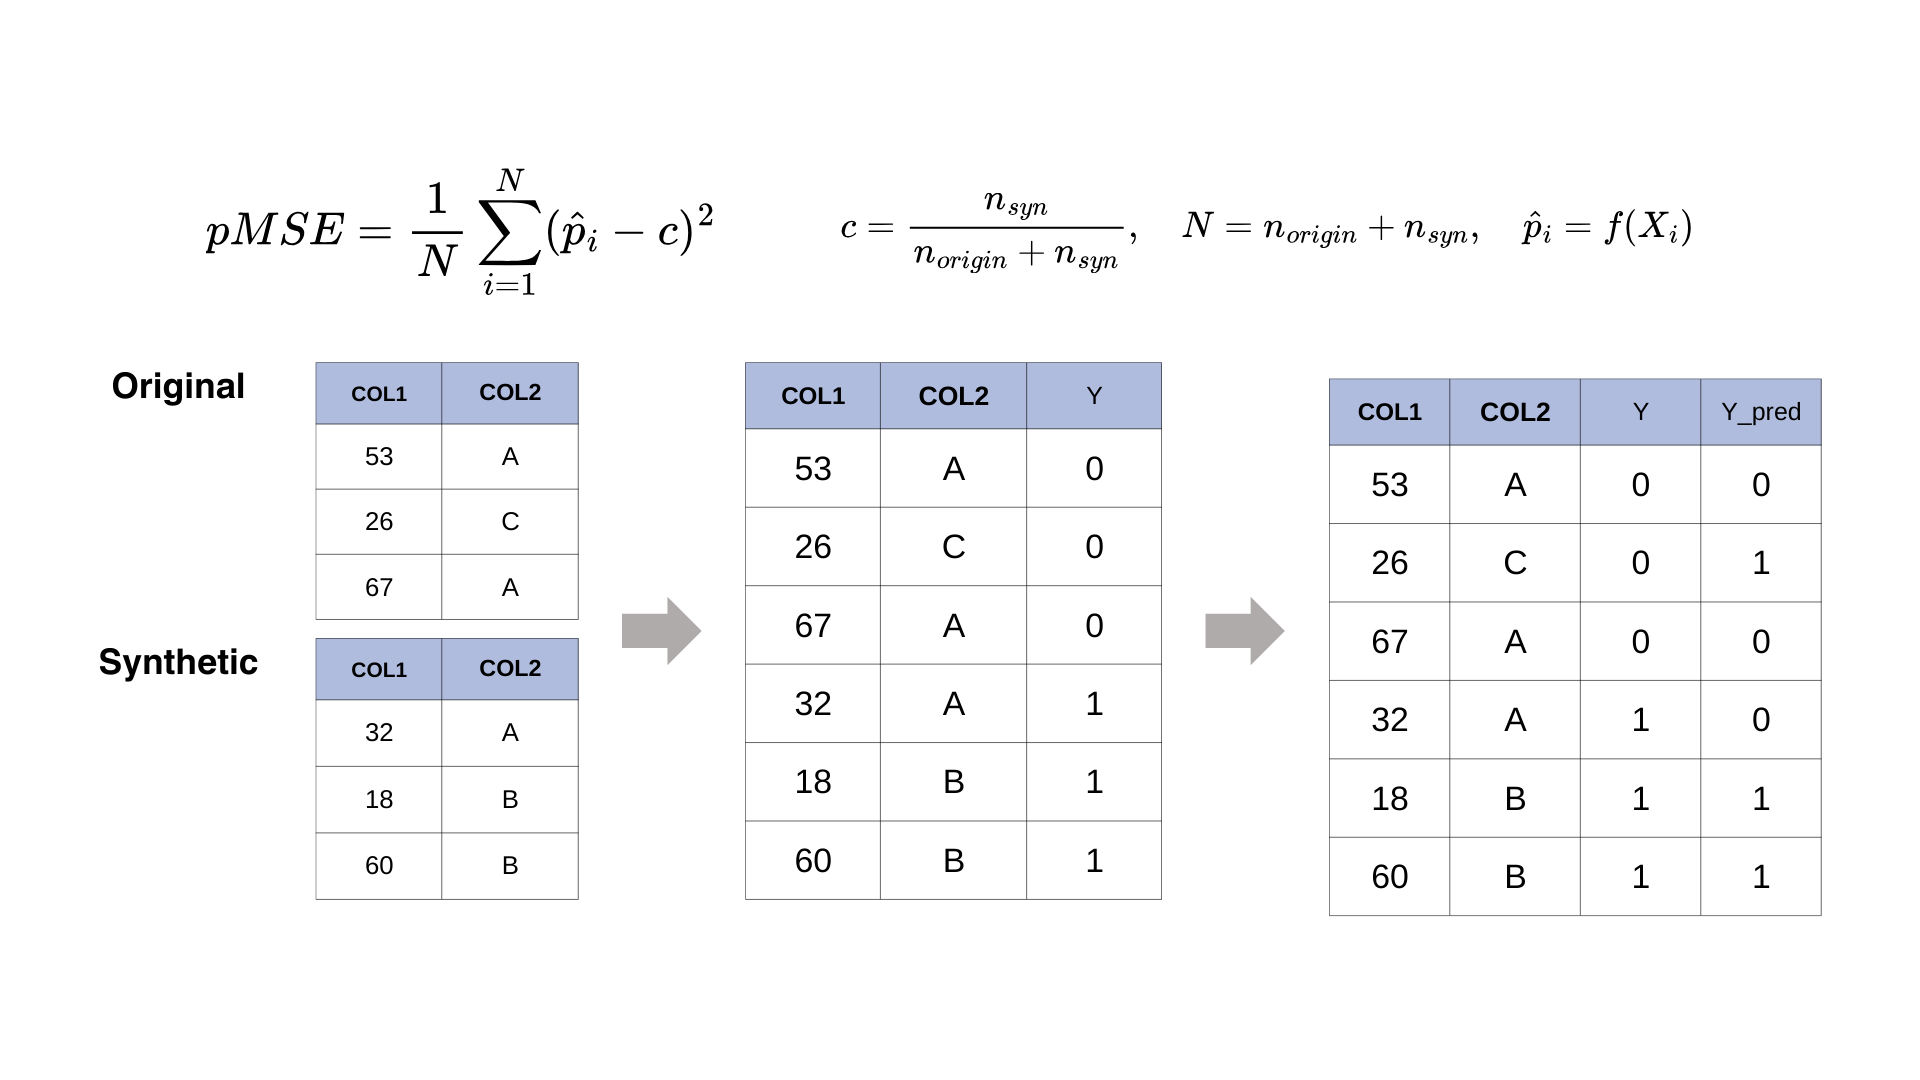
Check 1: Can you tell real from synthetic? (Propensity score matching)
If a classifier can easily tell “real” vs “synthetic” rows from the features alone, the synthetic data is too different and might leak information about who’s in the real set (membership inference). Propensity score matching measures this: train a classifier to predict real vs synthetic, and look at the scores. If real and synthetic scores are well separated, the synthetic data is too distinguishable. You want them to overlap.
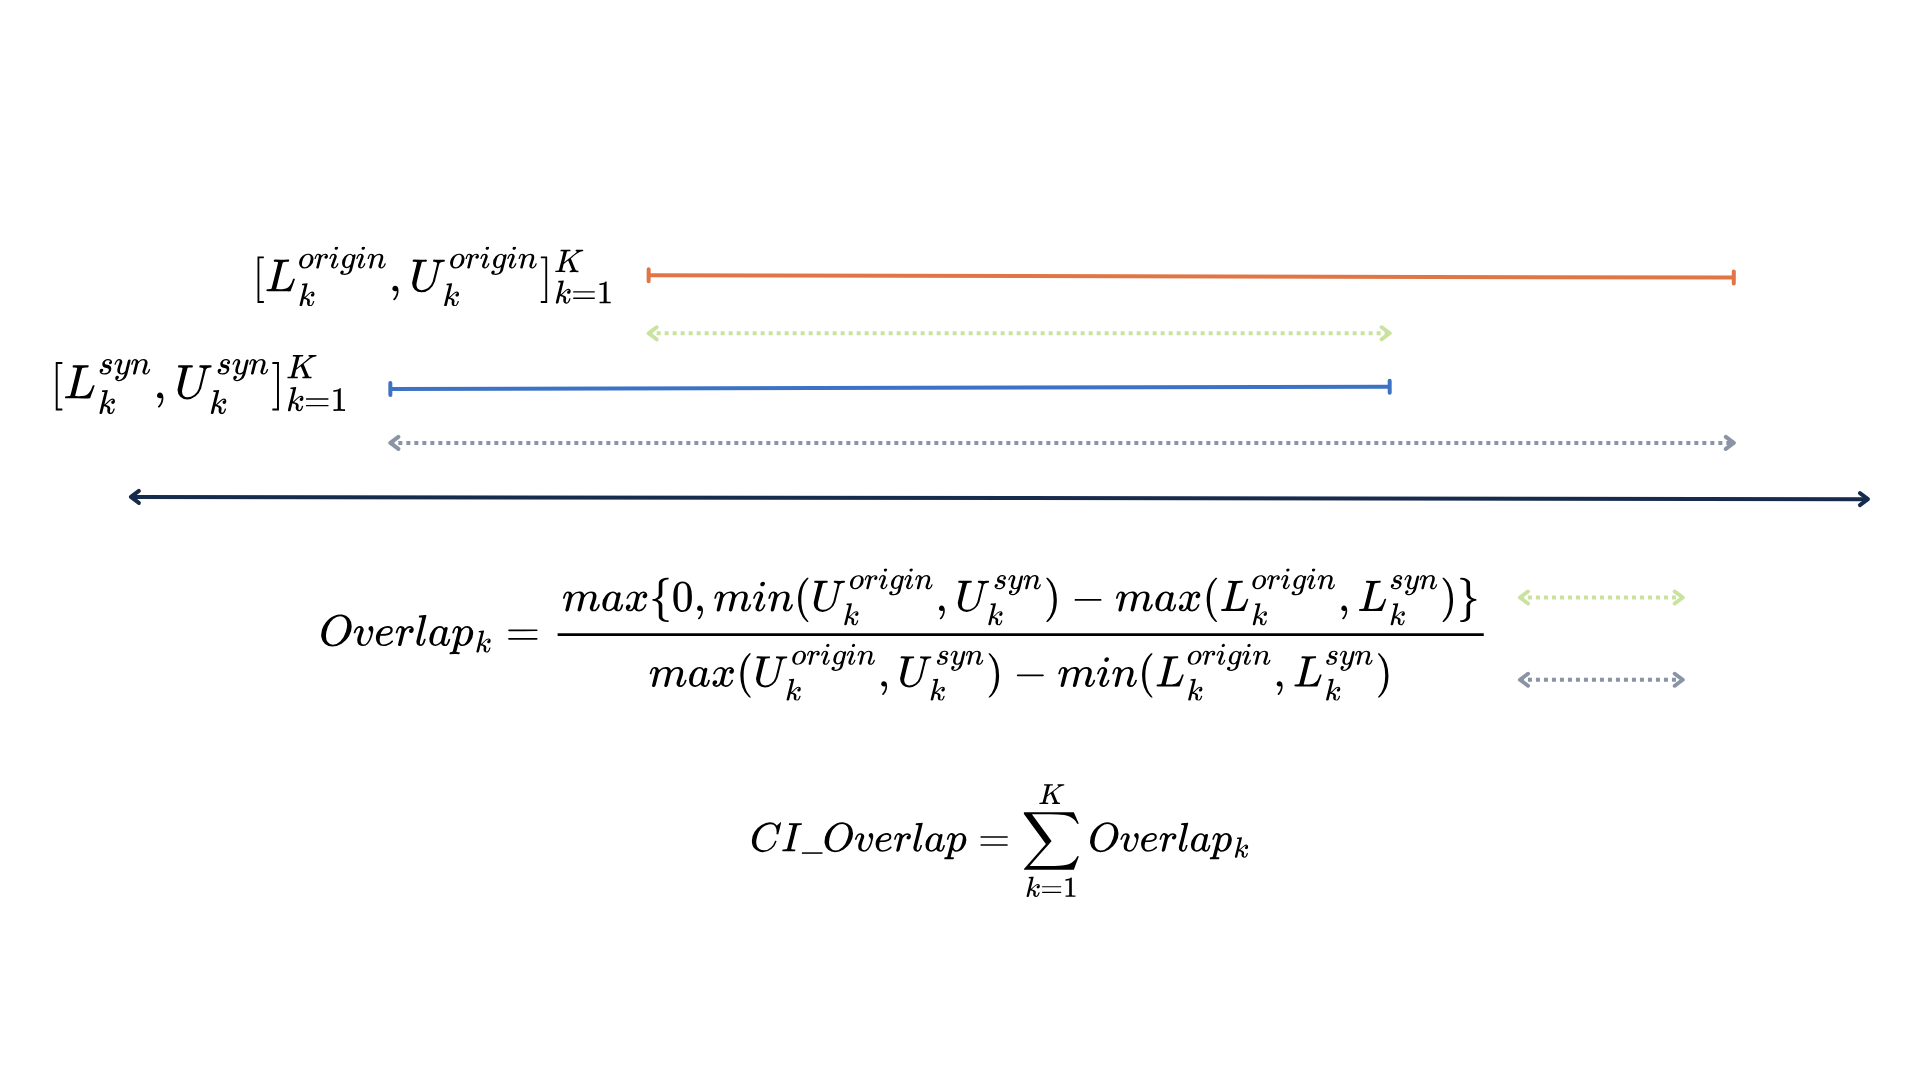
Check 2: Do key statistics match? (CI overlap)
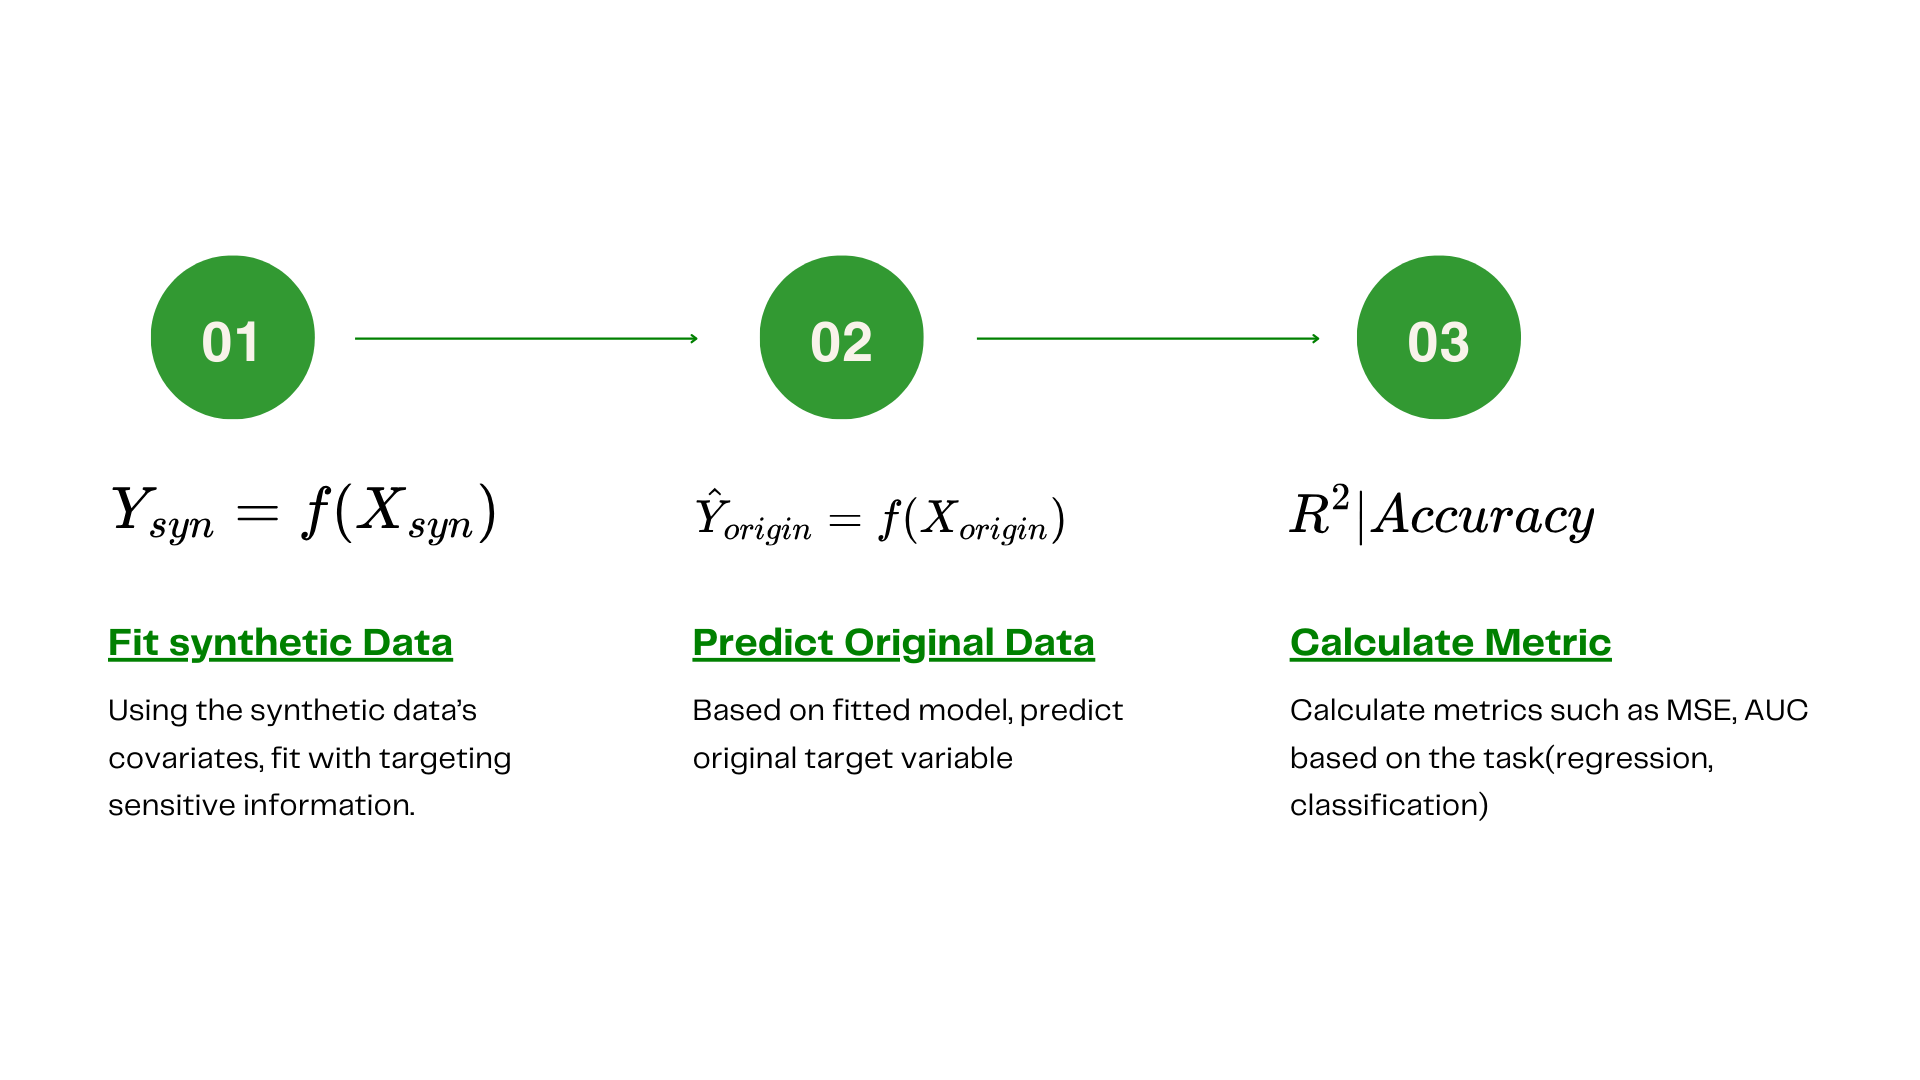
You usually care that statistics you care about (means, proportions, regression coefficients) are similar in the synthetic data. CI overlap compares confidence intervals for a chosen statistic: estimate it from the real data and from the synthetic data. If the intervals overlap a lot, the synthetic data supports similar conclusions; if they don’t, it’s distorting that statistic. This is about utility for analysis, not row-by-row similarity.
Check 3: Re-identification risk (Quasi-identifiers)
Even without names or IDs, combinations of columns (e.g. age + ZIP + gender) can identify people. Quasi-identifier checks ask: do too many synthetic rows look like specific real individuals on those combinations? Keeping that risk low matters when you release or share synthetic data.
Summary
Sequential synthesis is a practical, CPU-only option when you need interpretable generation or don’t have a GPU. To evaluate what you generate: propensity score matching (can you tell real from synthetic?), CI overlap (do key statistics match?), and quasi-identifier metrics (re-identification risk). In practice, the synthpop package in R and syn_seq in synthcity in Python are enough to get started.
References
-
Synthpop — Nowok, B., Raab, G. M., & Dibben, C. (2016). synthpop: Bespoke creation of synthetic data in R. Journal of Statistical Software, 74(11), 1–26. doi:10.18637/jss.v074.i11.
-
TabSyn — Zhang, H., Zhang, J., Srinivasan, B., et al. (2024). Mixed-type tabular data synthesis with score-based diffusion in latent space. ICLR. arXiv:2310.09656.
-
CTGAN / TVAE — Xu, L., Skoularidou, M., Cuesta-Infante, A., & Veeramachaneni, K. (2019). Modeling tabular data using conditional GAN. NeurIPS, 32. arXiv:1907.00503.
-
Synthetic data overview — Jordon, J., Szpruch, L., Houssiau, F., et al. (2022). Synthetic data — what, why and how? arXiv preprint. arXiv:2205.03257.
-
Synthcity — Qian, Z., Cebere, B.-C., & van der Schaar, M. (2023). Synthcity: facilitating innovative use cases of synthetic data. arXiv preprint. arXiv:2301.07573.
Other posts
- Can we really get alpha from market data?
Efficient Market Hypothesis, Micro Alphas, and why probabilistic forecasting matters for turning signals into positions.
- What works for forecasting macro economic series with deep learning?
Data quirks of macro series, which model families work (and which don’t), and why it’s rarely one-size-fits-all.
- Could multivariate time series have their own representations?
Identifiable innovations, diagonal dynamics, and iVDFM: factor recovery, interventions, and probabilistic forecasting.
- Can we make a more risk-aware portfolio agent from utility theory?
Recursive (Epstein–Zin) utility with Monte Carlo certainty equivalents in PPO/A2C, on Korean ETF splits.
- Effective Bird Sound Classification
Mel spectrograms and EfficientNet for bird sound: why the mel scale helps and how to keep the pipeline simple.